Getting reliable, up-to-date college basketball data shouldn’t be a hassle. With cbbdata, it isn’t. This package makes it straightforward to access a wide range of stats with minimal effort.
Easy Access: cbbdata simplifies the process of fetching college basketball statistics. No more scraping or searching through multiple sources: just clean, easy access to the data you need.
Fast and Accurate: Built with Flask and Python, cbbdata uses SQL queries and direct file transfers to ensure you get accurate and current data quickly. Our database is updated every 15 minutes during the season.
Comprehensive Data: Whether you need player stats, team analytics, game results, or advanced metrics, cbbdata has you covered with nearly 30 endpoints.
Installation
You can install the development version of cbbdata from GitHub with:
# install.packages("devtools")
devtools::install_github("andreweatherman/cbbdata")
Registering for an API key
An API key is free and easy to obtain by using the official cbbdata R package. To register, simply pass a username and password to the cbd_create_account endpoint. Your API key will be emailed to you – make sure to check your spam folder – but you need not manually store your API key anywhere. The preferred way to access your account is with your username and password.
Note: If you want to access KenPom data, your CBBData account email must match your KenPom account email
# to register
cbbdata::cbd_create_account(username = 'xxx', email = 'xxx', password = 'xxx', confirm_password = 'xxx')
Obtaining Your Key
After registering, there are two ways to obtain your key using the cbbdata R package.
By-Session Log-In:
To obtain your key for use in your current R session, you can pass your username and password to the cbd_login function. This will retrieve your key and store it as a session variable. If you restart or leave your R session, you will need to log-in again.
# per-session log-in
cbbdata::cbd_login(username = 'xxx', password = 'xxx')
Persistent Log-In (Preferred):
The recommended way to interact with the CBBData API is to store your username (CBD_USER) and password (CBD_PW) inside the .Renviron file. If you are unsure on how to do this, the cbd_login function will walk you through the process. Please note that this will require restarting your R session.
# persistent log-in
cbbdata::cbd_login()
If your API key is not stored as a session variable, cbbdata functions will grab your credentials from the .Renviron file and automatically log you in. With this method, you will not have to log-in again.
Available Data
cbbdata provides broad access to leading college basketball resources. cbbdata is continuously growing and the available data includes:
Barttorvik:
Developer Andrew Weatherman wrote the popular toRvik R package. cbbdata replaces toRvik and brings with it a rich collection of Barttorvik data.
Metric Ratings:
- Year-end ratings (
cbd_torvik_ratings) - Day-by-day ratings (
cbd_torvik_ratings_archive) - Team four factor splits (
cbd_torvik_team_factors)
E.g., if you want to see what the no-bias T-Rank top 10 looks like:
cbbdata::cbd_torvik_team_factors(year = 2024, no_bias = TRUE) %>%
  dplyr::slice(1:10) %>%
  dplyr::select(team, barthag, adj_o, adj_d)
#> # A tibble: 10 × 4
#>    team           barthag adj_o adj_d
#>    <chr>            <dbl> <dbl> <dbl>
#>  1 Houston          0.978  119.  85.7
#>  2 Connecticut      0.977  127.  92.0
#>  3 Purdue           0.967  126.  93.8
#>  4 Auburn           0.953  120.  92.6
#>  5 Arizona          0.952  121.  93.0
#>  6 Iowa St.         0.950  114.  88.0
#>  7 Tennessee        0.945  116.  90.5
#>  8 North Carolina   0.937  119.  93.9
#>  9 Duke             0.935  121.  95.7
#> 10 Marquette        0.928  118.  94.4
Player Data:
- Individual game logs (
cbd_torvik_player_game) - Season averages (
cbd_torvik_player_season) - Season splits (
cbd_torvik_player_split)
E.g., if you want to see which ACC player averages the most points at home:
Team + Conference Data:
- Team stats splits (
cbd_torvik_team_split) - Team histories (
cbd_torvik_team_history) - Conference four factor splits (
cbd_torvik_conf_factors)
E.g., if you want to see which conferences shoot the best at home against top 100 teams:
cbbdata::cbd_torvik_conf_factors(2024, venue = 'home', top = 100) %>%
  dplyr::filter(games >= 5) %>%
  dplyr::slice_max(efg, n = 5) %>%
  dplyr::select(conf, games, efg)
#> # A tibble: 6 × 3
#>   conf  games   efg
#>   <chr> <dbl> <dbl>
#> 1 P12      78  52.8
#> 2 B10     125  51.6
#> 3 B12     121  51.3
#> 4 MWC      70  51.2
#> 5 BE      108  51.1
#> 6 ACC     112  51.1
Game Data:
- Individual game box (
cbd_torvik_game_box) - Individual game four factors (
cbd_torvik_game_factors) - Individual game stats (box + factors) (
cbd_torvik_game_stats) - Season schedule (
cbd_torvik_season_schedule)
E.g., if you want to track how Duke’s offense has performed this season:
cbbdata::cbd_torvik_game_factors(year = 2024, team = 'Duke') %>%
  ggplot2::ggplot(aes(date, adj_o)) +
  ggplot2::geom_line() +
  ggplot2::geom_point(aes(color = result), size = 3) +
  ggplot2::scale_color_manual(values = c('darkred', 'darkgreen'), guide = NULL) +
  ggplot2::theme_minimal()
Predictions
- Individual game predictions (
cbd_torvik_game_prediction) - Team season predictions (
cbd_torvik_season_prediction) - Team season simulations (
cbd_torvik_season_simulation)
E.g., if you want to run 10,000 simulations of Duke’s season with their performance as of today:
# no date -> defaults to today
cbbdata::cbd_torvik_season_simulation('Duke', 2024) %>%
  ggplot2::ggplot(aes(wins, probability)) +
  ggplot2::geom_col() +
  ggplot2::scale_y_continuous(labels = scales::label_percent())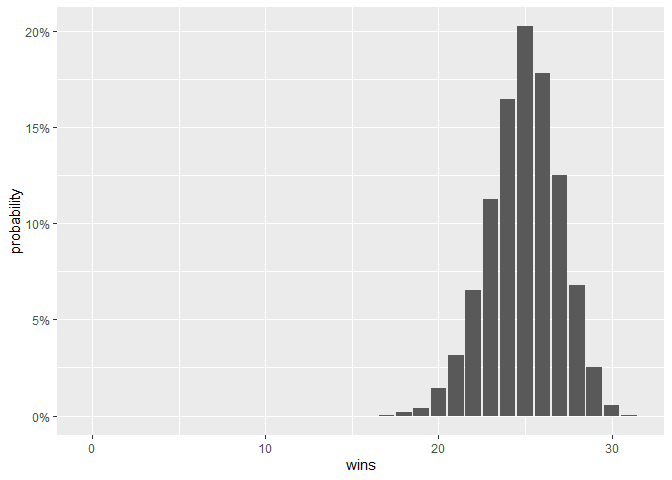
Tournament Results + Resumes
- Daily NET rankings and quadrant records (
cbd_torvik_current_resume) - Historical NET rankings and per-day metrics (
cbd_net_archive) - Tournament performance (
cbd_torvik_ncaa_results) - Tournament “committee sheets” (
cbd_torvik_ncaa_sheets) - Resume database (
cbd_torvik_resume_database) - Similar team tournament resumes (
cbd_torvik_similar_resumes)
E.g., if you want to pull the five teams with the most Q1 NET wins:
cbbdata::cbd_torvik_current_resume() %>%
  dplyr::mutate(q1_wins = readr::parse_number(quad1)) %>%
  dplyr::slice_max(q1_wins, n = 5) %>%
  dplyr::select(team, conf, q1_wins, net)
#> # A tibble: 5 × 4
#>   team        conf  q1_wins   net
#>   <chr>       <chr>   <dbl> <int>
#> 1 Connecticut BE         19    12
#> 2 Purdue      B10        18    16
#> 3 Houston     B12        17     1
#> 4 Tennessee   SEC        14     5
#> 5 Texas A&M   SEC        13    21
KenPom
To access KenPom data, you must have an active KenPom subscription and your CBBData account email must match your KenPom account email; this exists to curb account sharing. To activate your account, pass your KenPom account password through the cbd_kenpom_authorization function. The CBBData API will then confirm your account is active and log your expiration date. You will only be asked to re-authorize on that date.
# persistent log-in
cbbdata::cbd_kenpom_authorization(password = 'xxx')